About database content
Yam (Dioscorea spp.) is a vital staple and medicinal crop. To centralize its scattered omics resources, we have developed the Yam Omics Database (YamOmics). It integrates comprehensive multi-omics data, including genomes, transcriptomes, plastid genomes, genomic variants from numerous germplasms, and gene expression profiles. The database provides extensive gene annotations and features user-friendly web-based tools for primer design, CRISPR design, expression analysis, enrichment analysis, and phylogenetic inference, supporting fundamental research and breeding in yam.
Quick tutorial (click items to show/hide details)
Explore omics
Through the omics menu, users can browse omics data including genome data, transcriptome, plastome data and variome data.
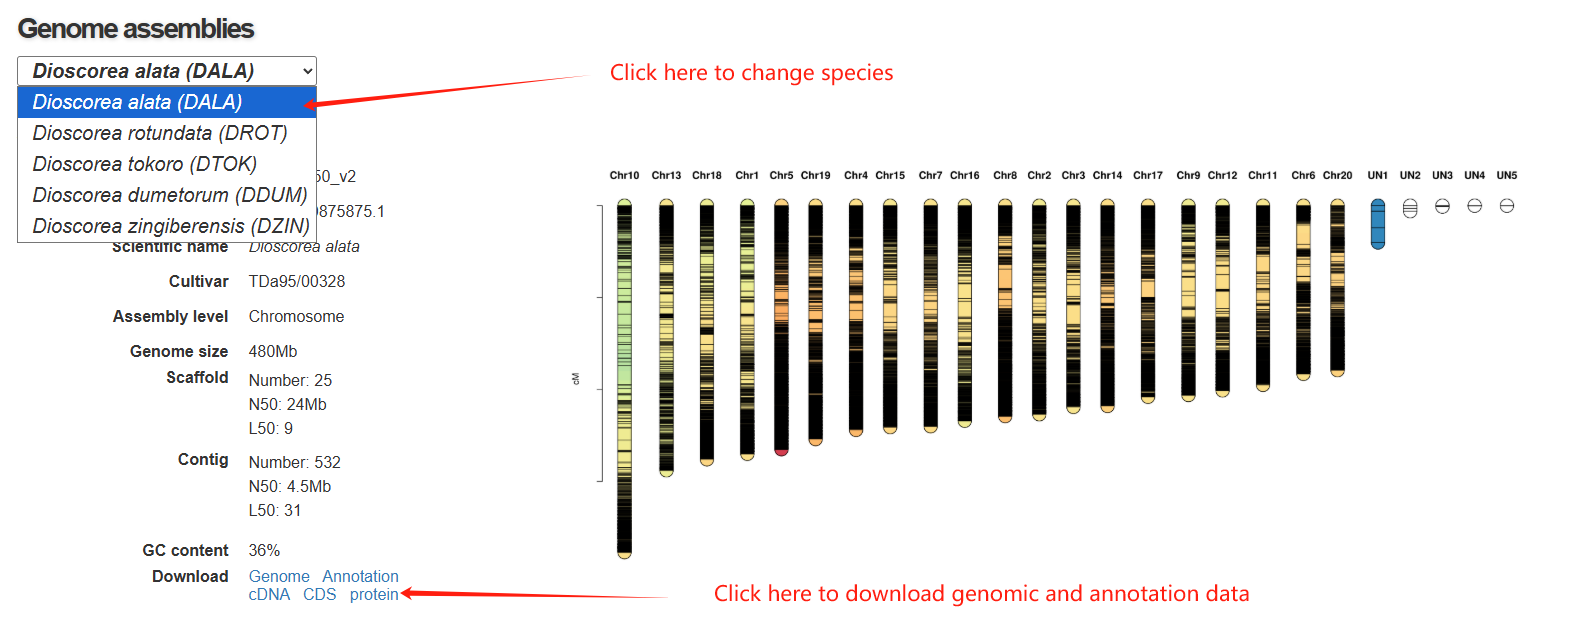
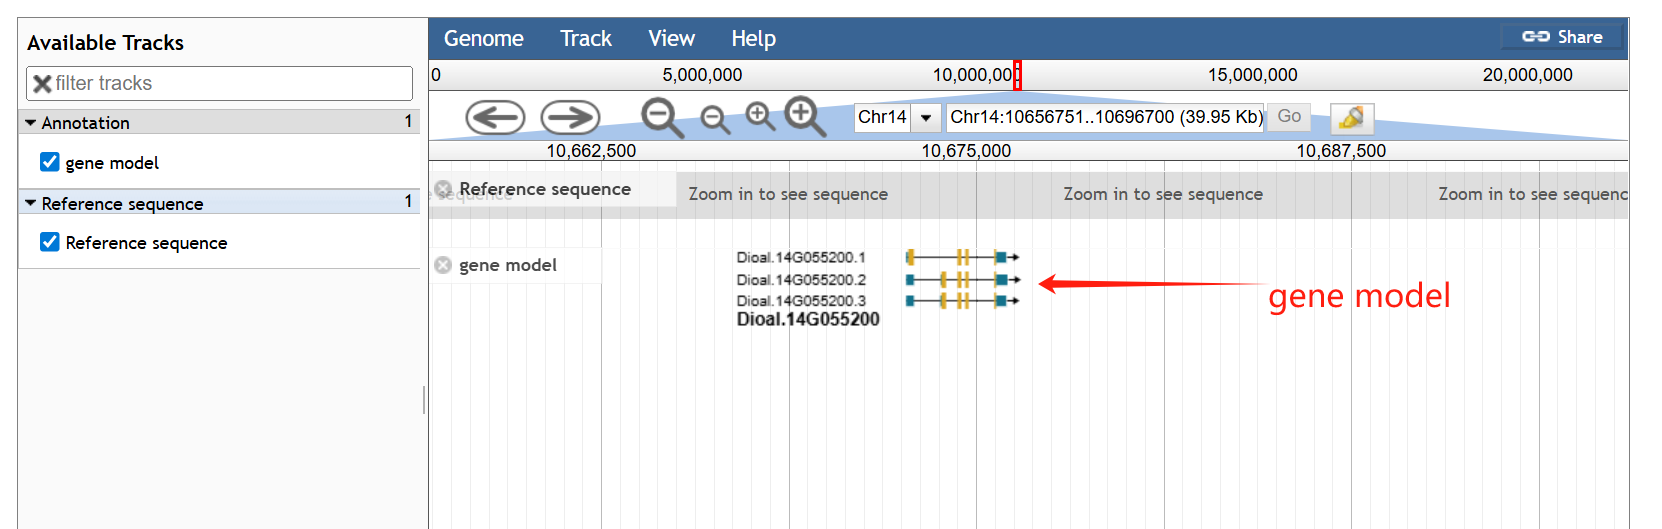
In the genome page, there are 4 section in the genome page. The first section is a statistical panel showing genome assembly information and the distribution of genes in chromosomes. Users can select different species via a drop-down menu. The second section is a genome browse showing genomic context.
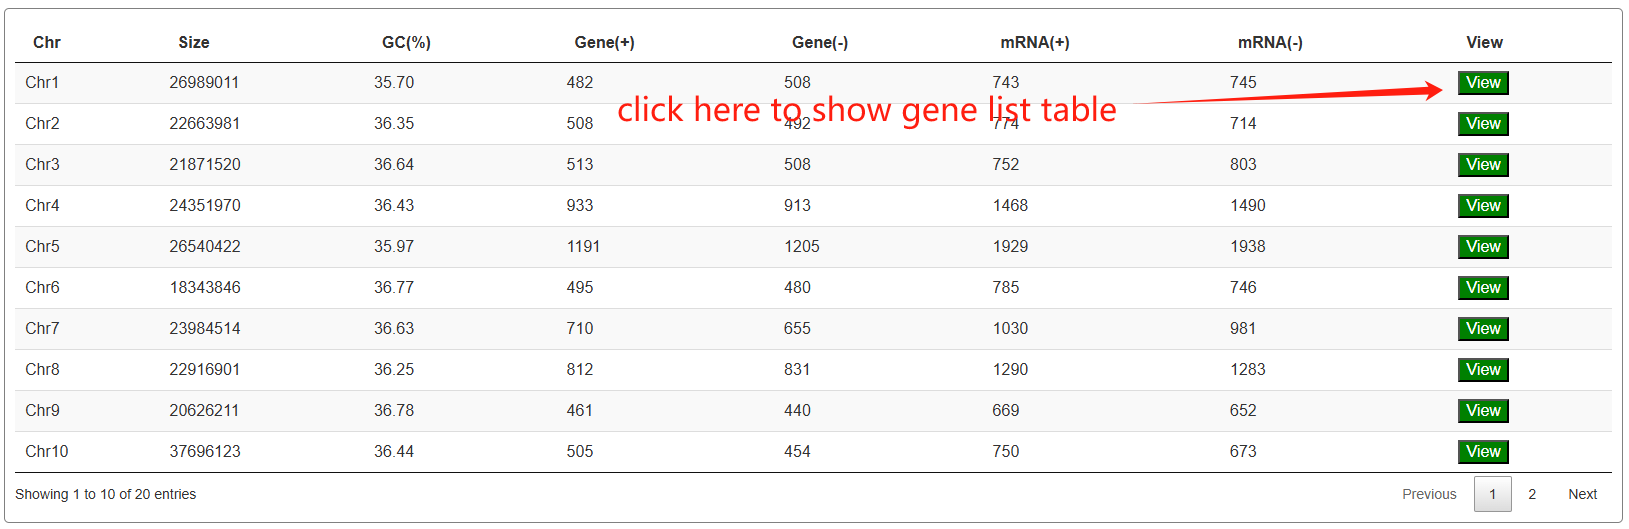
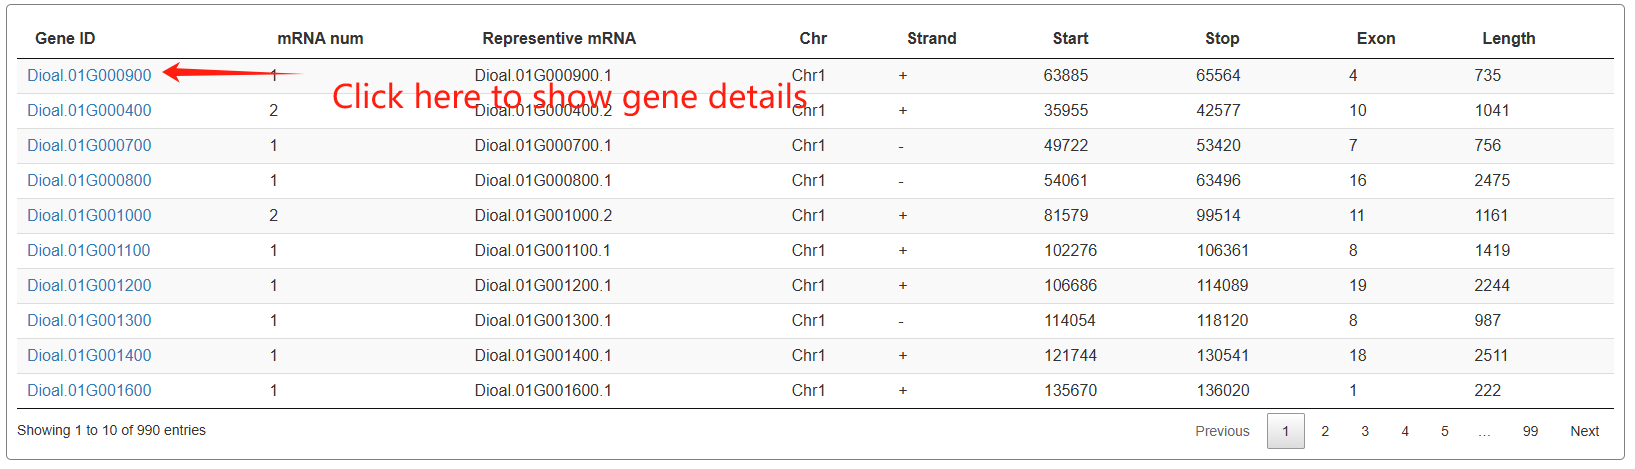
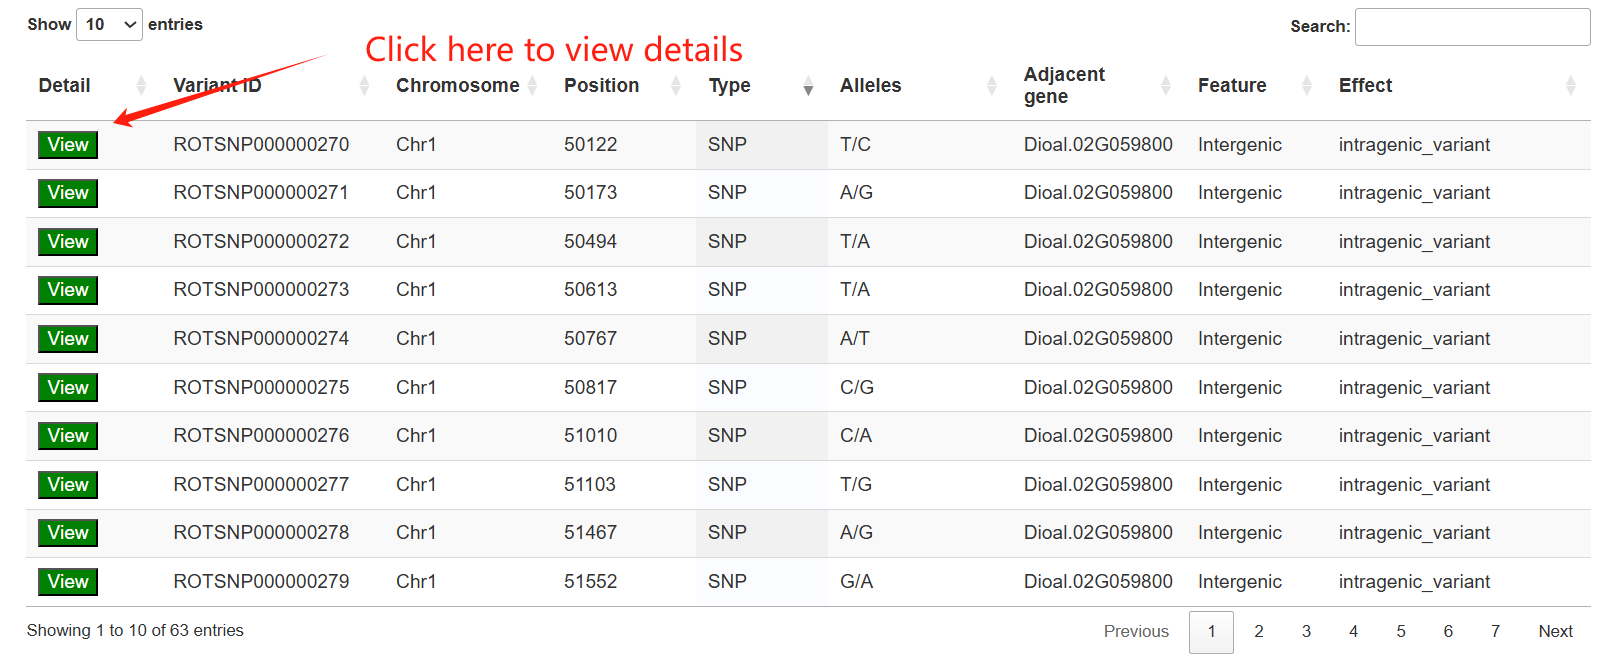
The third section features an interactive table that displays annotation statistics for all chromosomes. When users click the "View" button in the statistics table, a detailed list of all corresponding genes will be presented in the fourth section below.
The transcriptome page is composed of five main sections. The first section features a statistical panel that presents key information, including transcriptome assembly details, completeness estimation, and the length distribution of transcript proteins. Users can select different species via a drop-down menu.
The second section features an interactive table that lists transcripts by ortholog groups. Clicking the "View" button will trigger a column chart below in the third section, which visualizes the ortholog distribution across all yam species.
The fourth section provides an interactive table listing the genes corresponding to a selected ortholog group. The fifth section then presents a heatmap that visualizes the expression levels of these genes across various tissues.
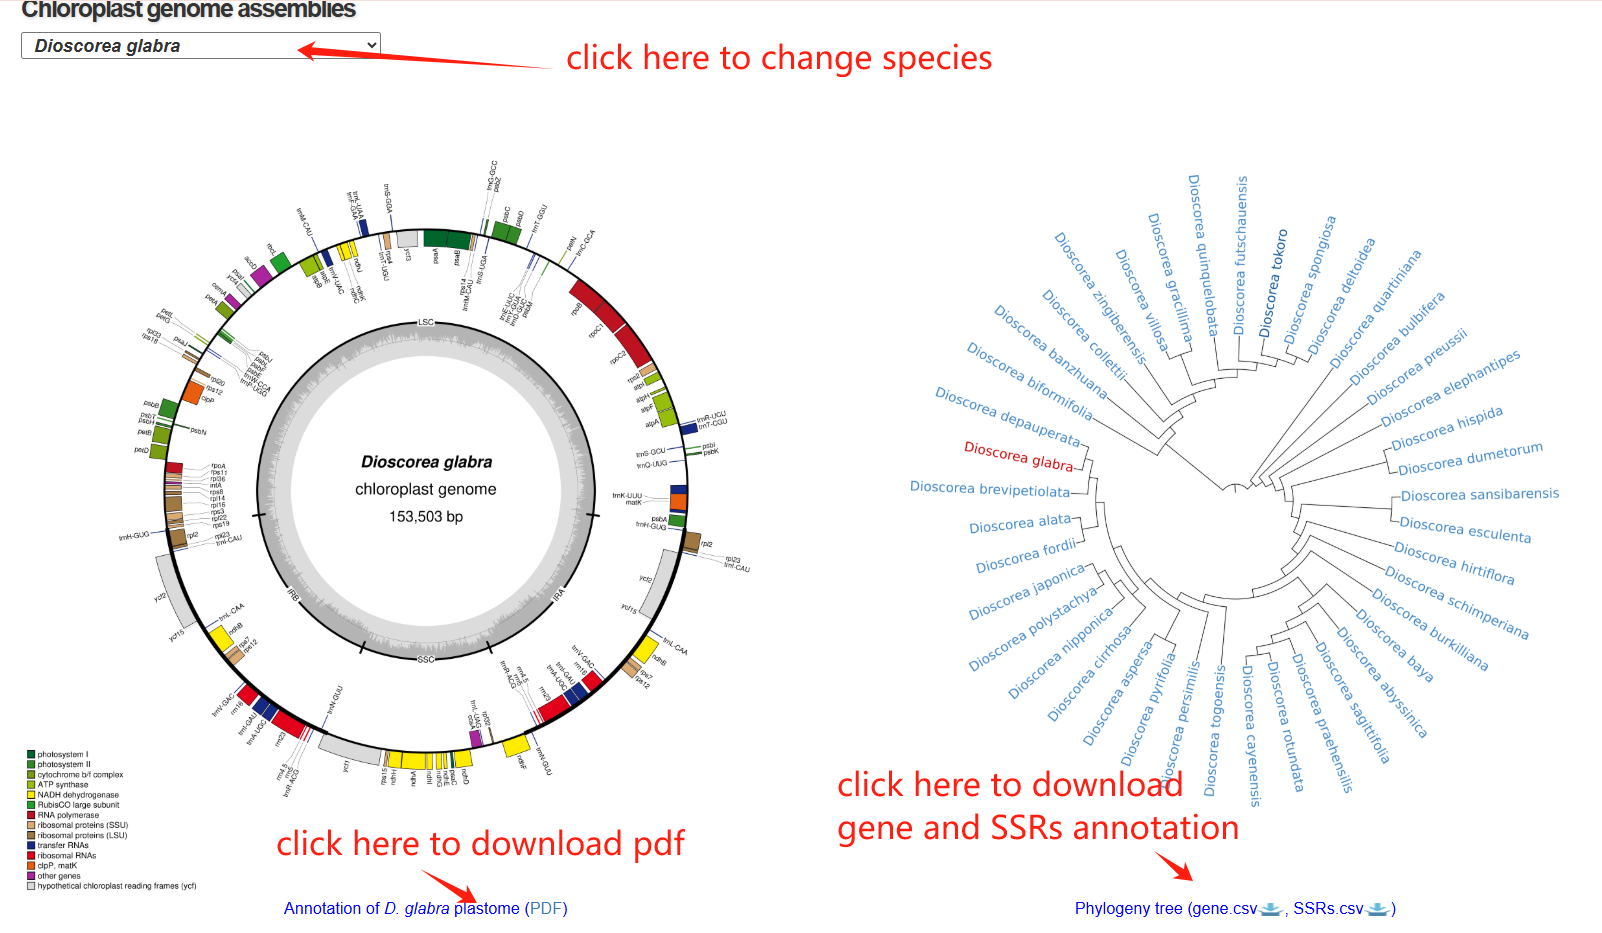
The plastome page is composed of three sections. The first section is a circular map of a plant chloroplast genome, showing the Large Single Copy (LSC), Small Single Copy (SSC), and Inverted Repeat (IR) regions, with annotated genes color-coded by functional categories. It provides an overview of genome structure, gene organization, and regional boundaries within the plastome. The second section presents a phylogenetic tree, which illustrates its placement within the broader evolutionary context of related species.
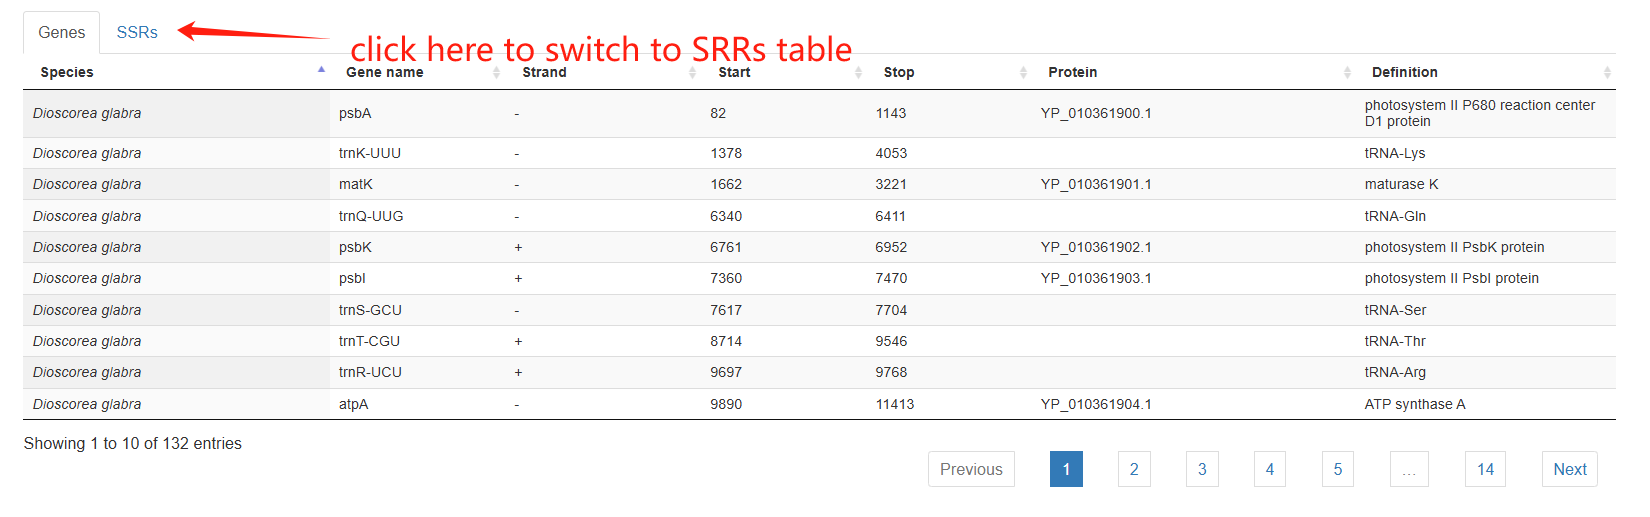
The third section is an interactive table showing the annotated genes and SSRs.
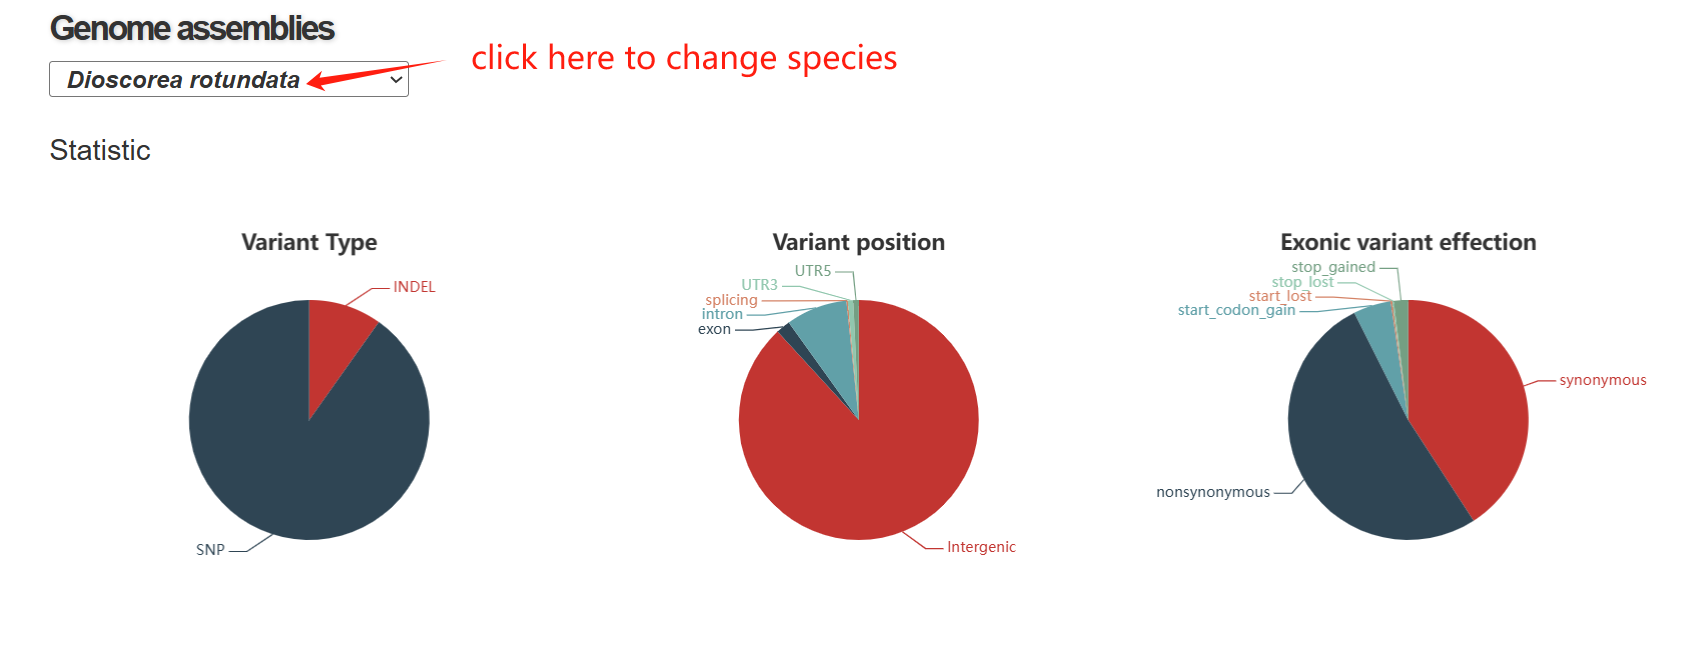
The variome page is composed of three sections. The first section includes three pie: (1) The first pie chart shows the proportion of SNPs and INDELs identified in the dataset, indicating that SNPs constitute the vast majority of detected variants. (2) The second pie chart illustrates the genomic locations of variants, revealing that most mutations occur in intergenic regions, with smaller fractions found in exons, introns, UTRs, and splicing sites. (3) The third pie chart summarizes the functional impact of coding variants, showing the proportions of synonymous, nonsynonymous, and high-impact mutations such as start/stop codon gains or losses.
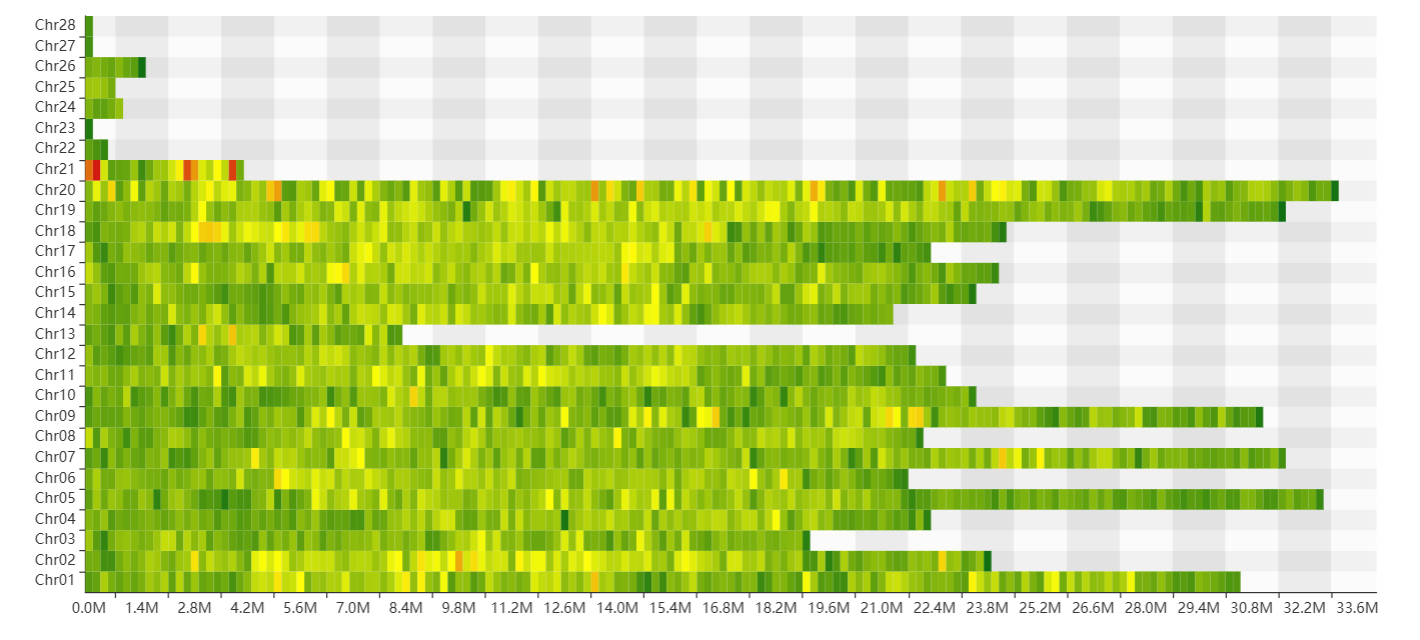
The second section features a heatmap that visualizes variant density across all chromosomes. Detailed variant counts are revealed by hovering over each bin.
The third section provides an interactive table listing variants for genomic positions of interest.
Explore genes
Through the genes menu, users can browse genes by pathway, family and genome synteny.
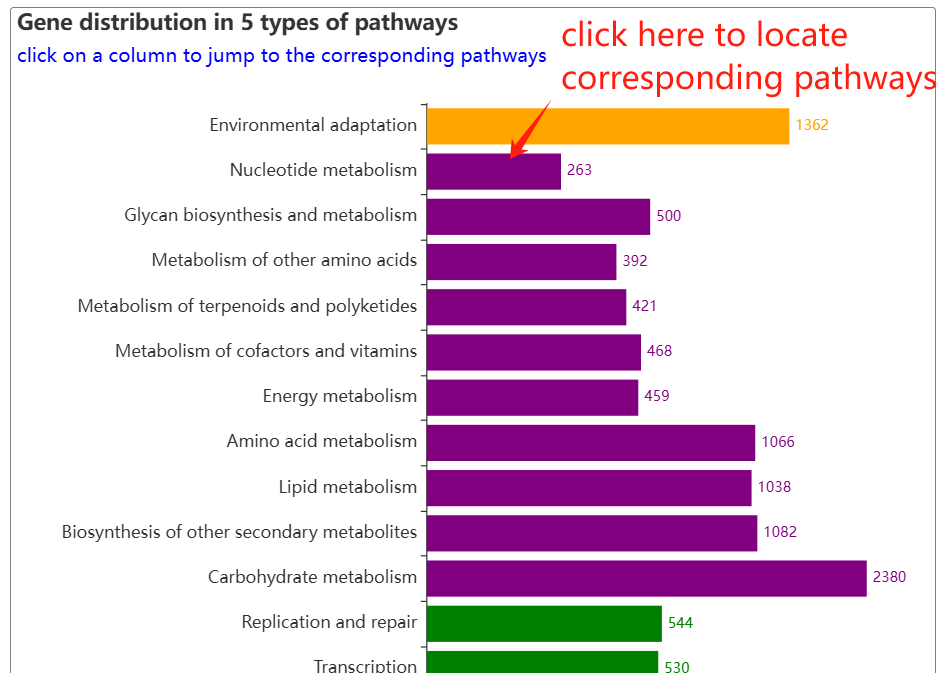
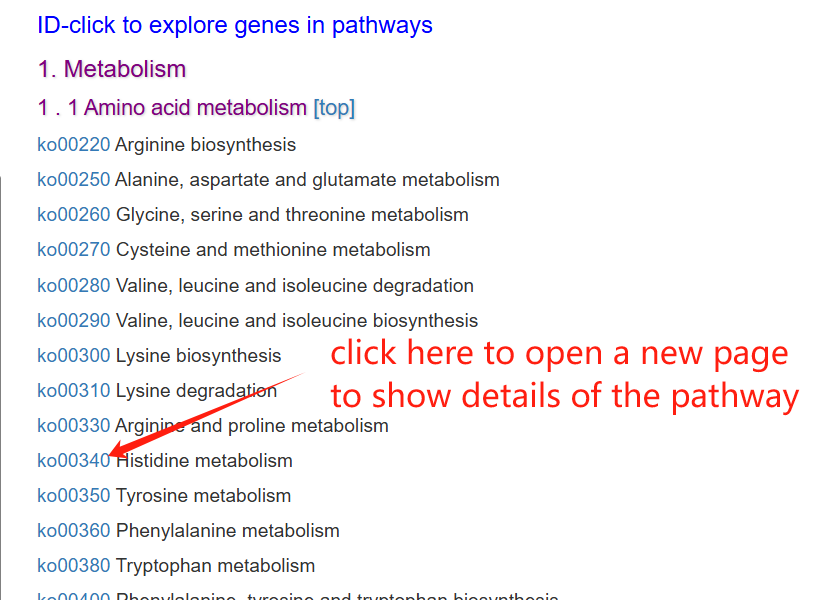
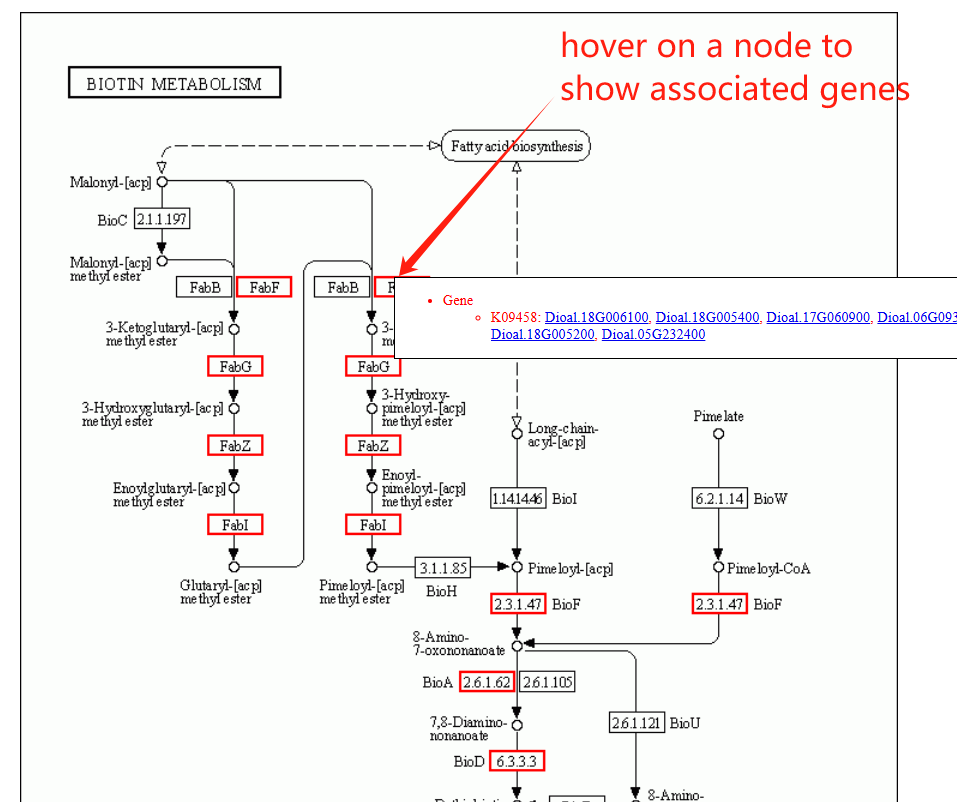
The pathway page features a column chart on the left, displaying gene counts across five major pathway types: Cellular Processes, Metabolism, Environmental Information Processing, Genetic Information Processing, and Organismal Systems. A complete list of all pathways is provided on the right. Clicking on any pathway name opens its dedicated detail page. Additionally, hovering over an ortholog node within the visualization will highlight its associated genes.
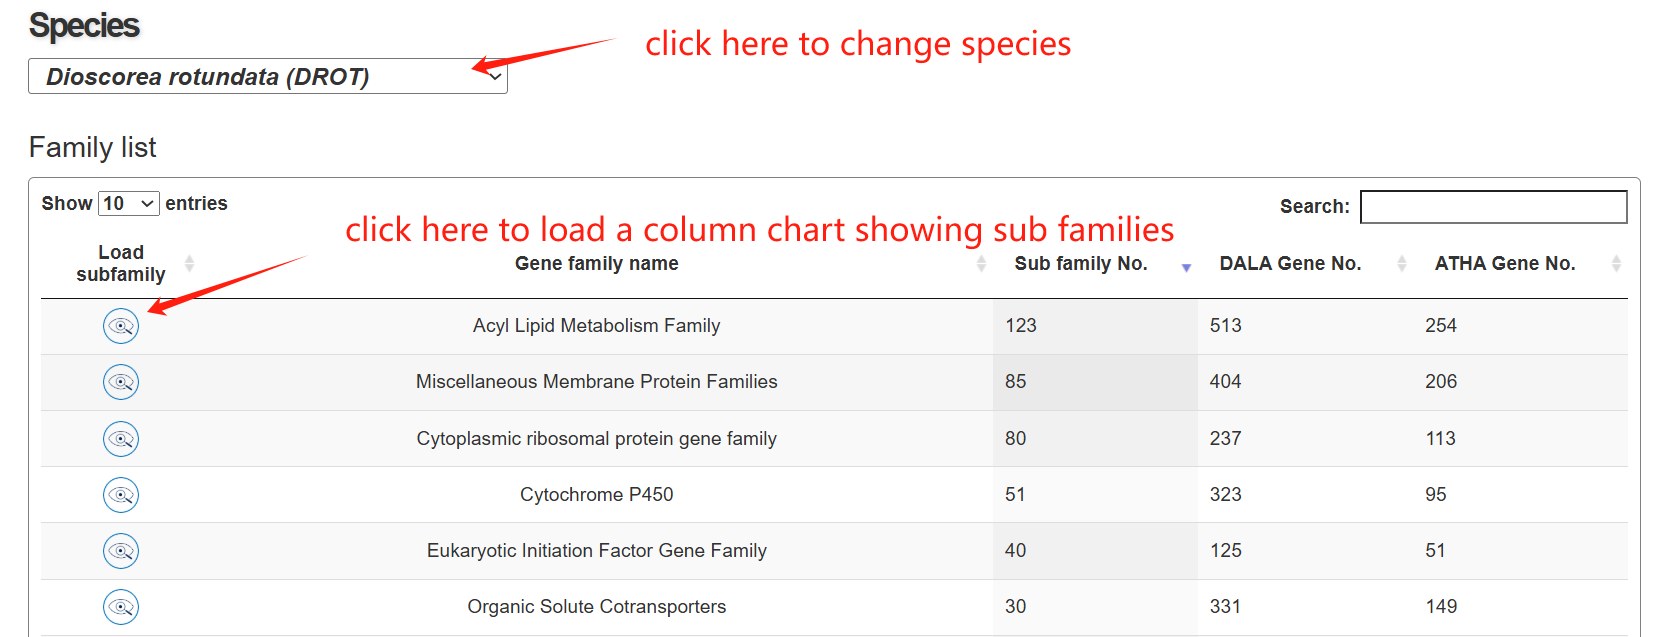
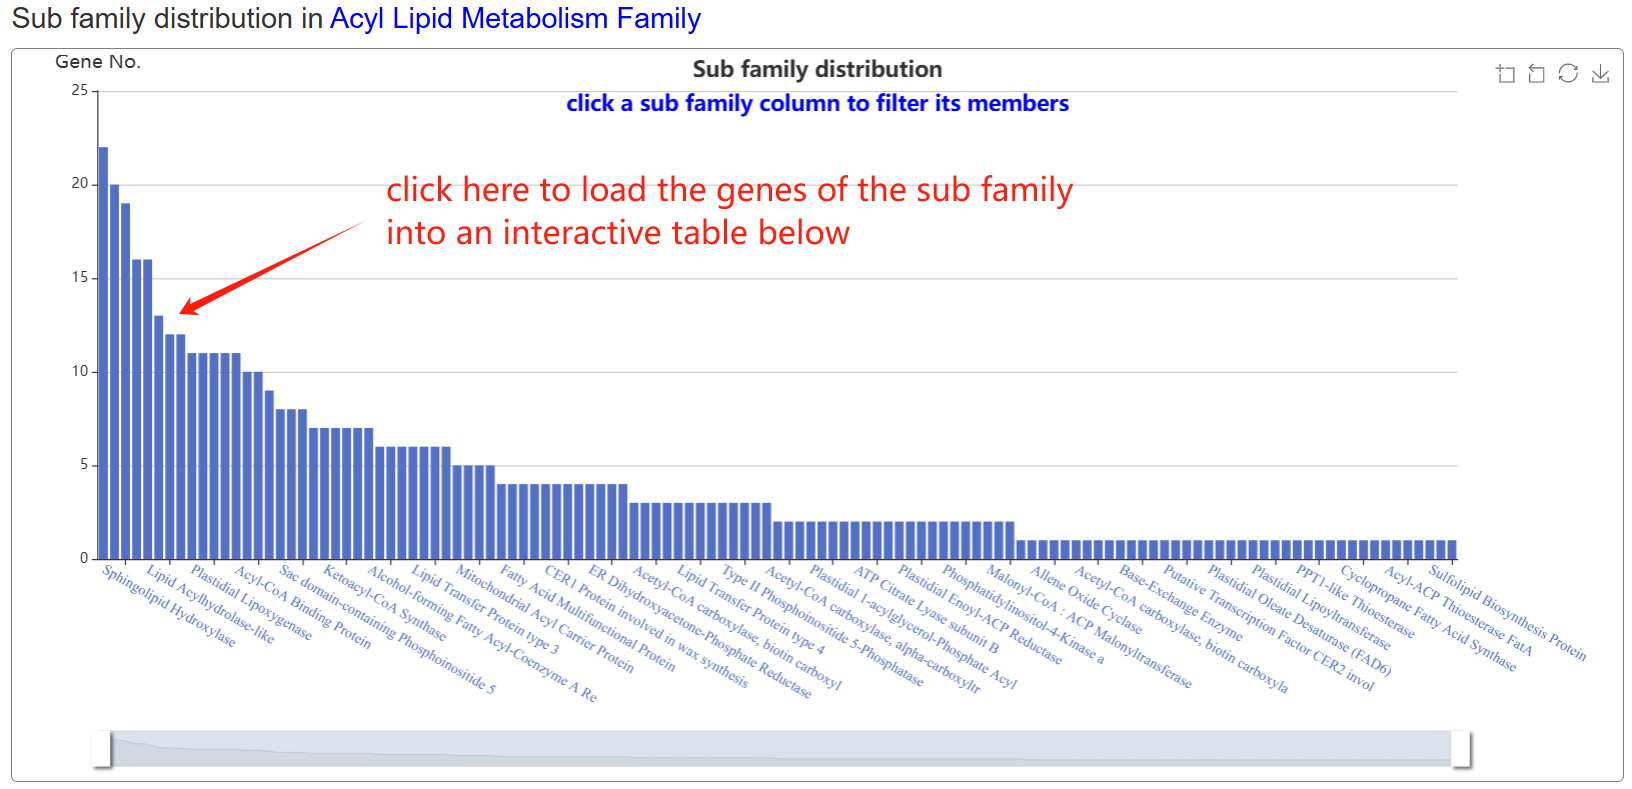
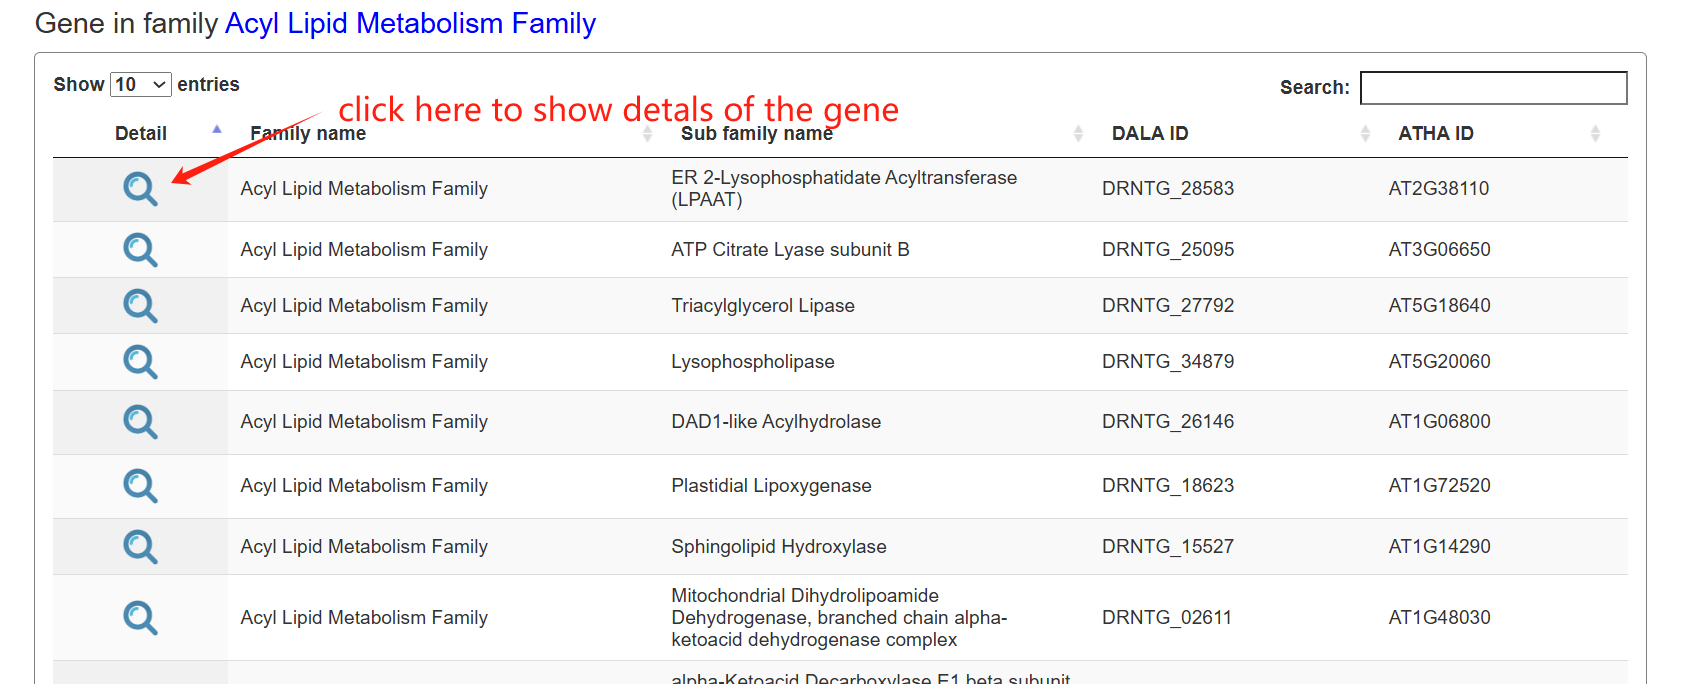
The family page comprises three main sections. The first section features an interactive table listing all gene families in the species, along with their corresponding subfamily counts. The second section contains a column chart that depicts the size distribution of subfamilies within a selected gene family. Upon clicking a column, users can load all genes belonging to that specific subfamily into an interactive table displayed in the section below.
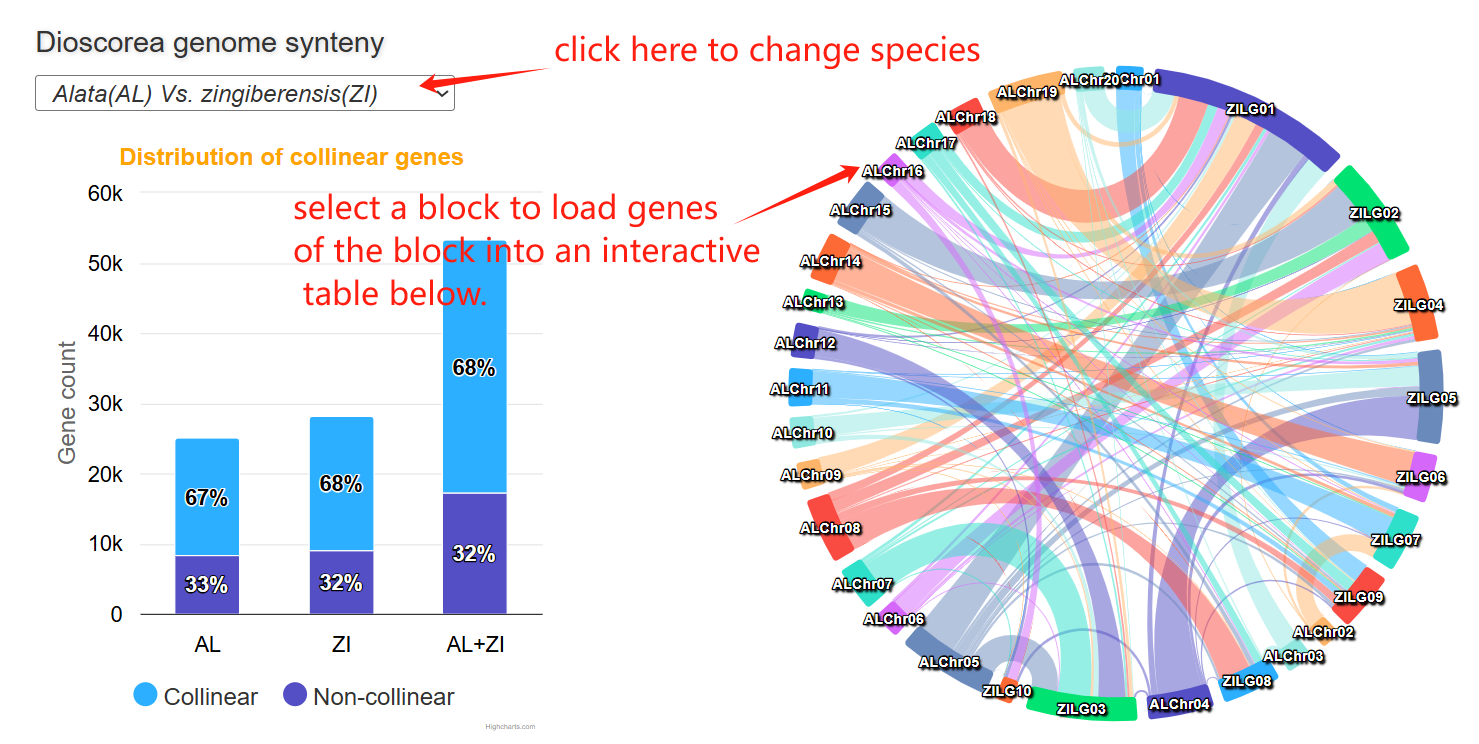
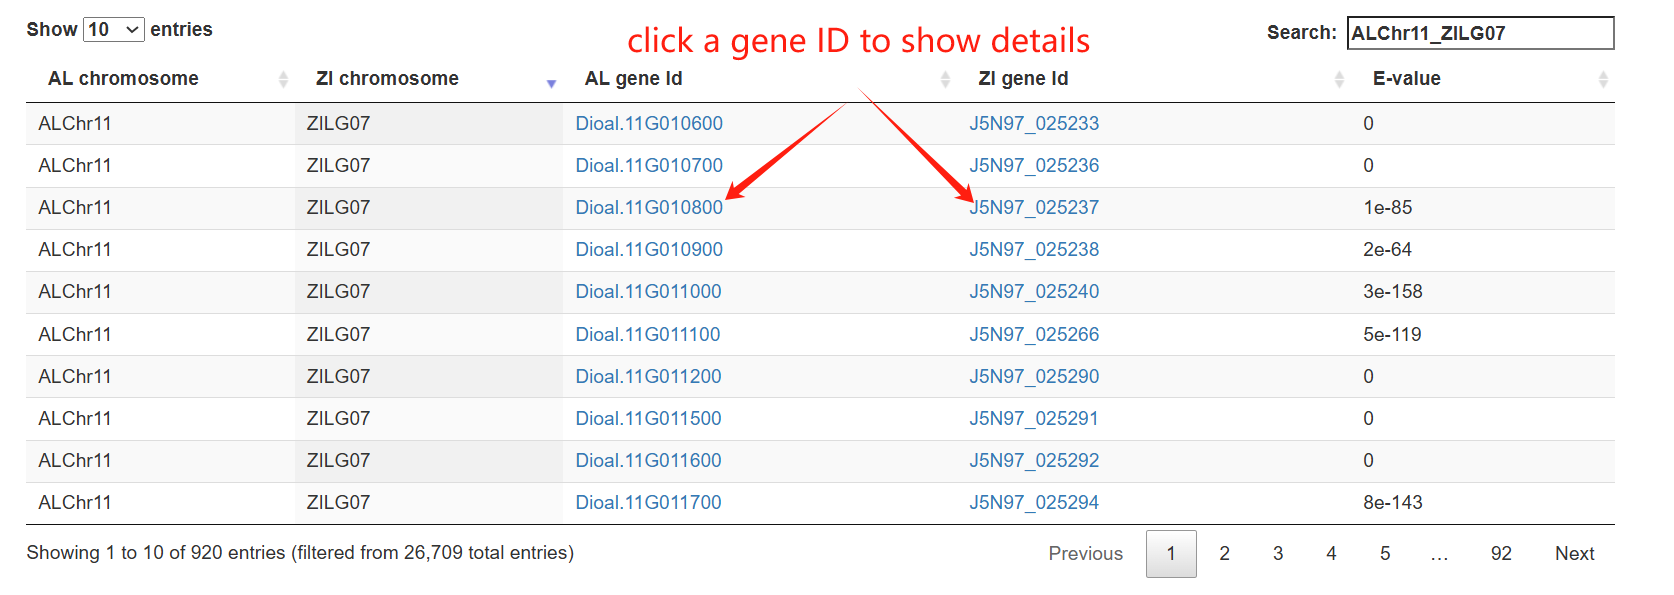
The genome synteny page comprises three main sections. The first section is a stacked bar chart showing the proportions of collinear and non-collinear genes in two genome and their combined gene set. The second section is a circos plot showing genome-wide collinearity relationships between two genomes. Clicking on any syntenic block will highlight it and load the corresponding collinear genes into the interactive table in Section 3 below.
Online tools
Through the tools menu, users can utilize six integrated online tools available in the Tools menu to carry out their analyses.
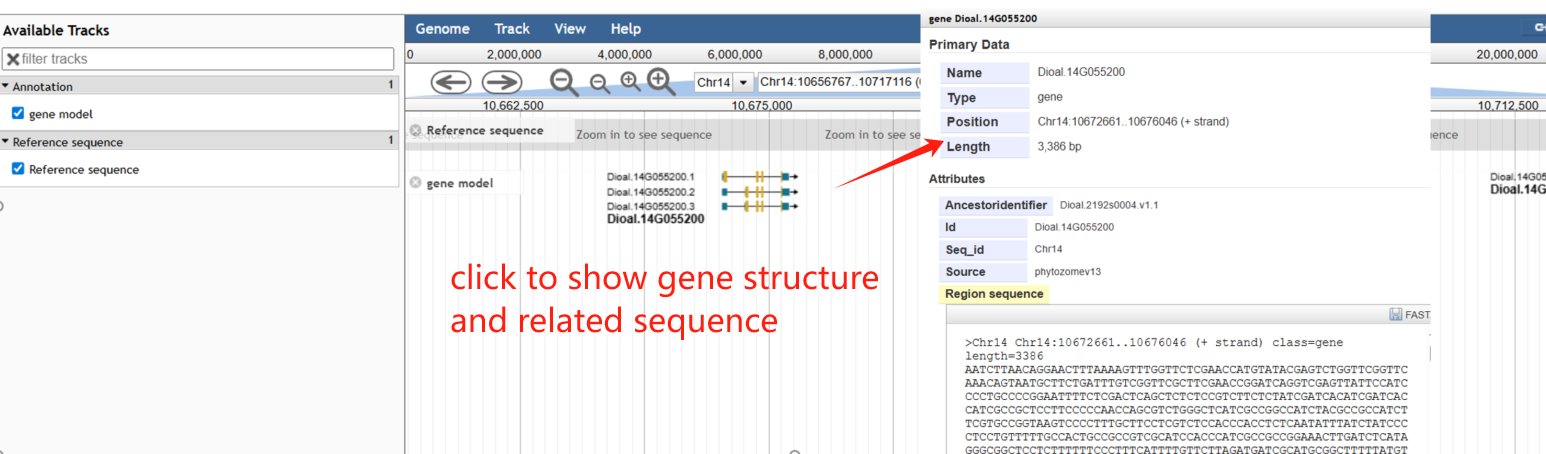
On the genome browser page, JBrowse is used to display the genomic context and gene structures, and to retrieve sequences of interest.
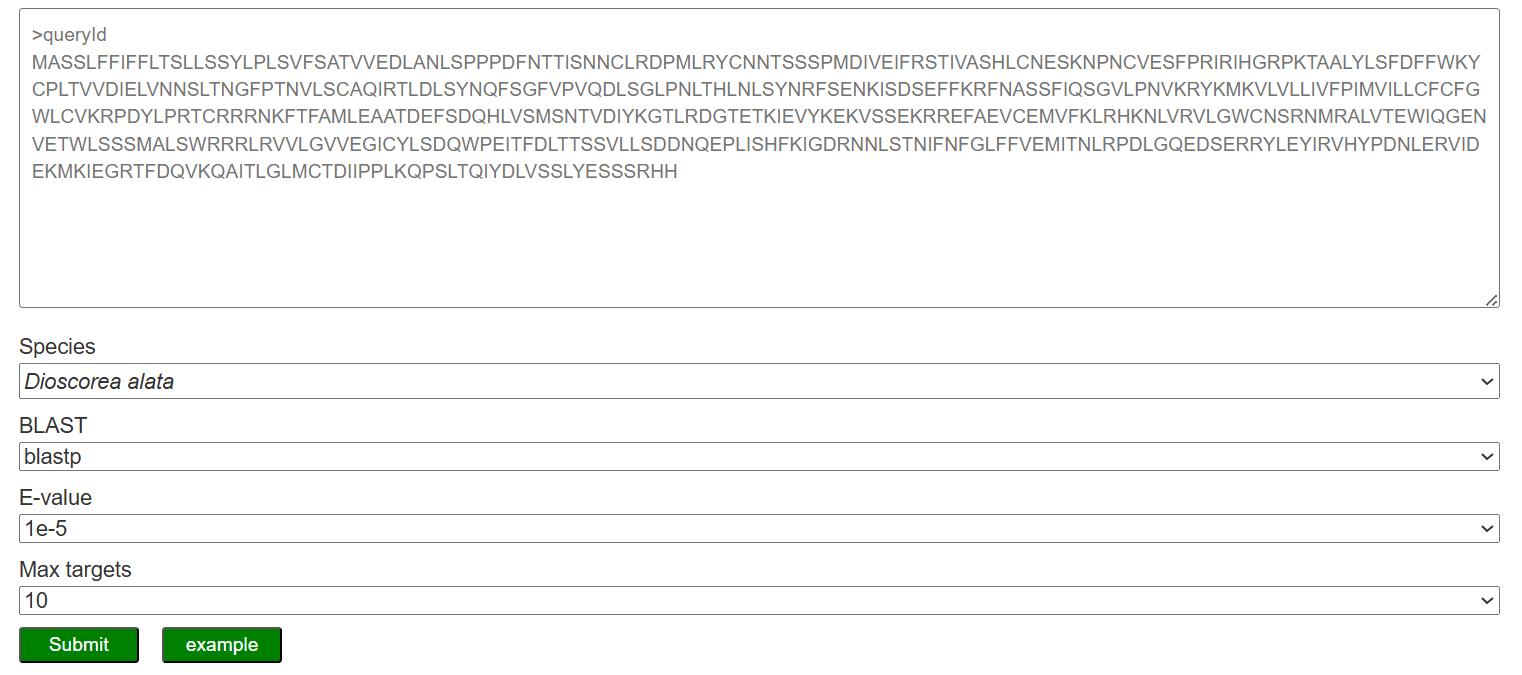
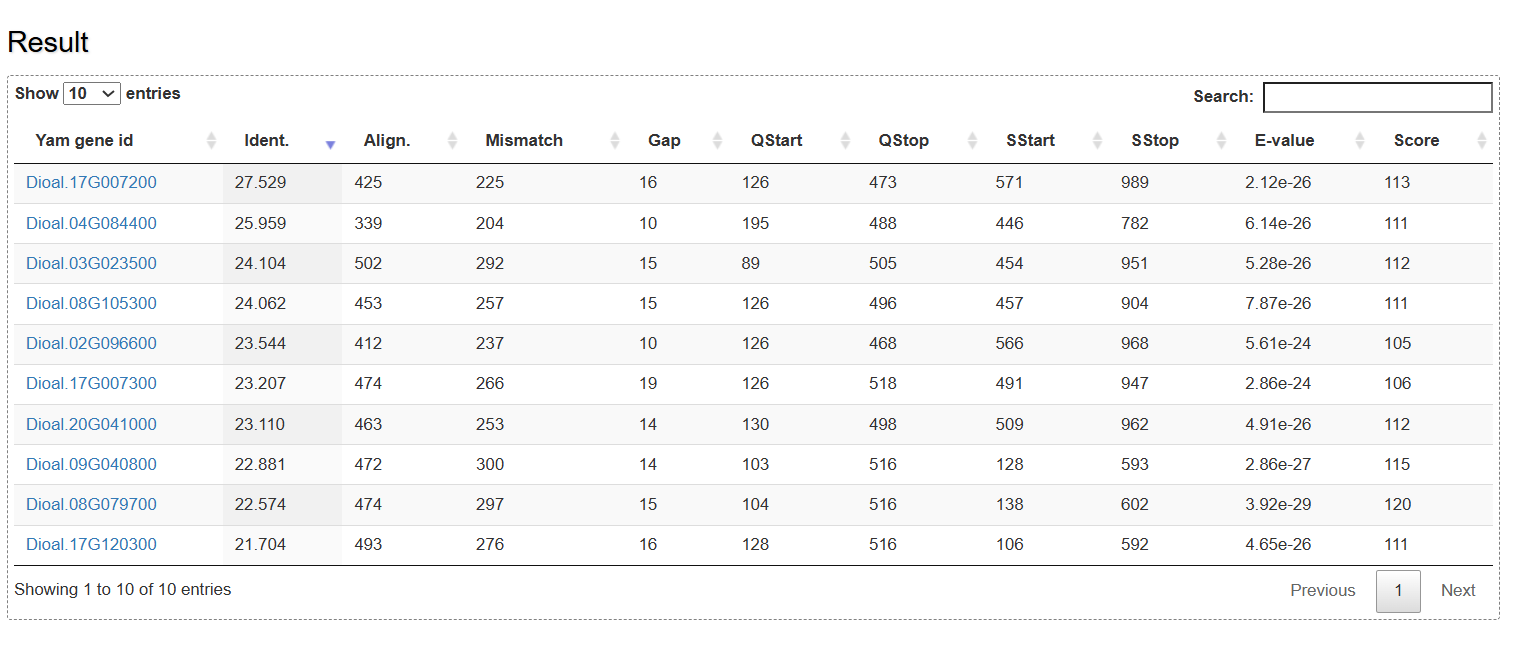
On the BLAST page, users can search yam genes based on sequence similarity using the BLAST program. The queried genes are listed in an interactive table with some parameters such as identity, alignment length, mismatch, gap, evalue and score.
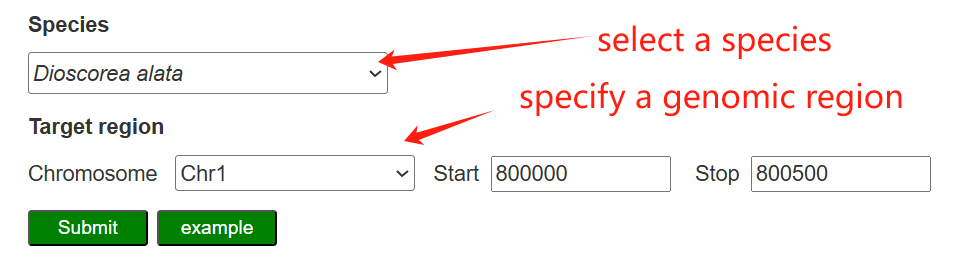
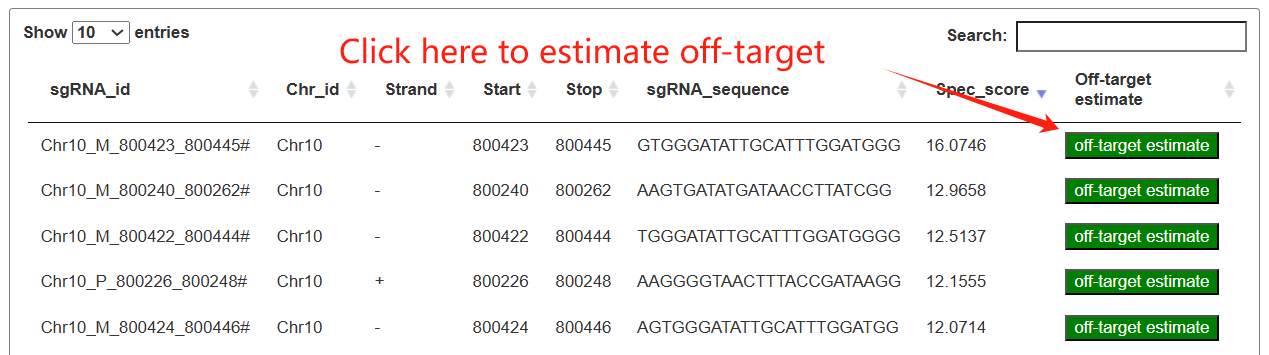
On the CRISPR design page, users first select a yam species and define a target genomic interval (chromosome and start–stop coordinates) to retrieve candidate SpCas9 sgRNAs for that region.
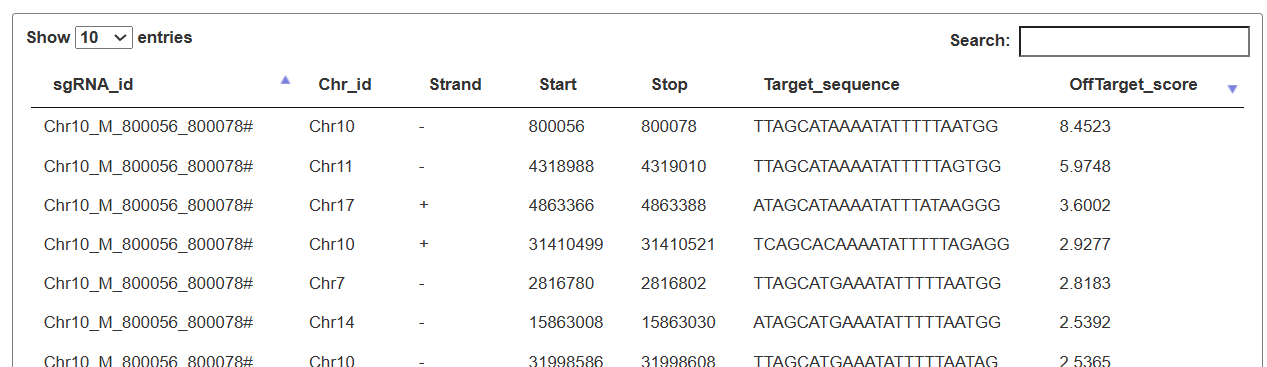
The resulting table lists each sgRNA with its genomic position, strand, sequence, and specificity score, and provides an “off-target estimate” button. By clicking this button, users can view a second table summarizing all predicted off-target sites and their off-target scores, which can be further filtered and searched for detailed evaluation.sers can specify a genomic region as editing object to obtain sgRNAs tailored.
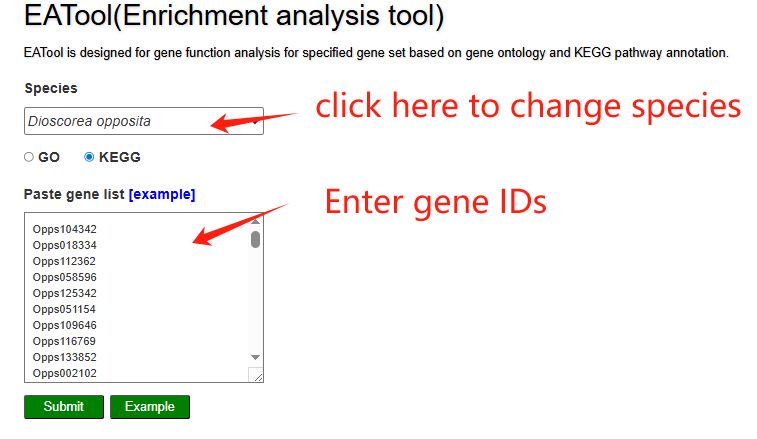
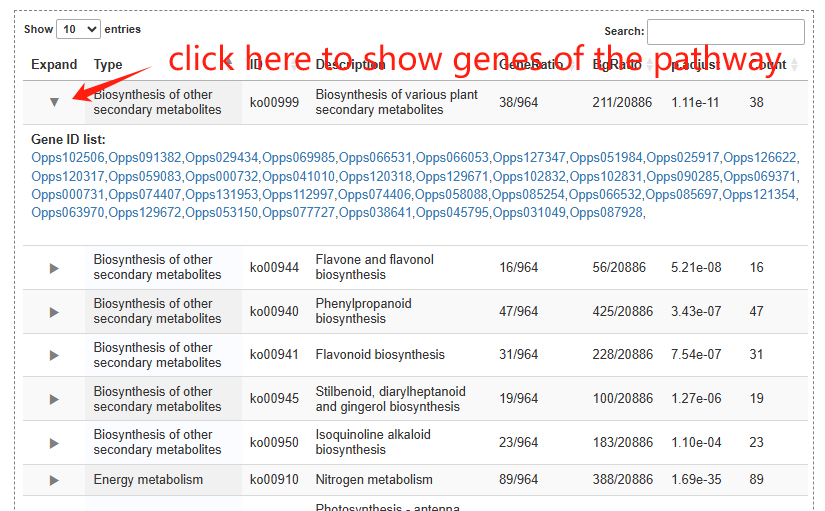
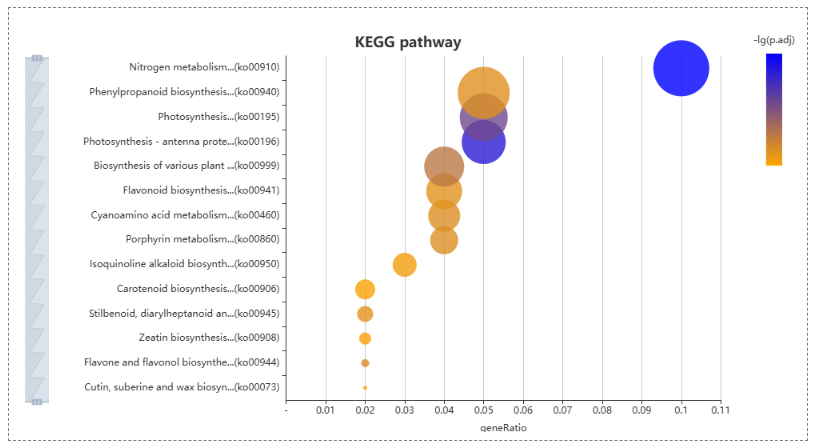
On the enrichement analysis page, users select the yam species, choose GO or KEGG and paste a list of gene IDs for enrichment analysis in the input panel. The results table lists significantly enriched pathways and allows users to expand each row to view the detailed genes contributing to that pathway. A bubble plot visually summarizes the enriched KEGG pathways, where bubble size reflects the gene ratio and color indicates the significance level.
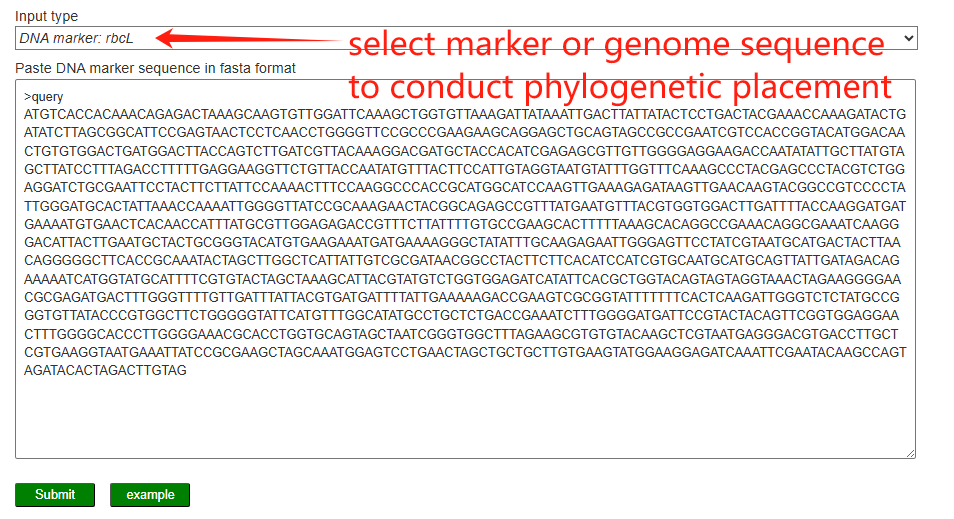
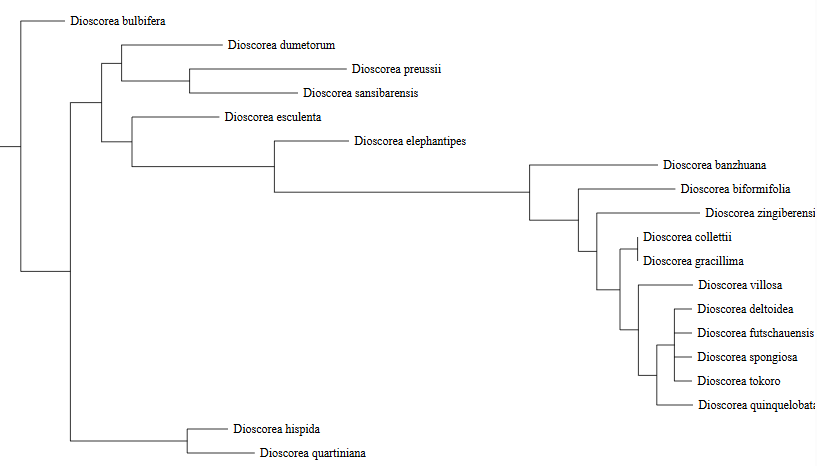
On the Phylogenetic placement page, users select an input type (chloroplast genome or DNA marker, e.g. rbcL) and paste the query sequence in FASTA format. The server then aligns the query to a reference dataset and constructs a phylogenetic tree to place the query within the existing Dioscorea species tree, allowing users to visualize its evolutionary position and closest relatives.
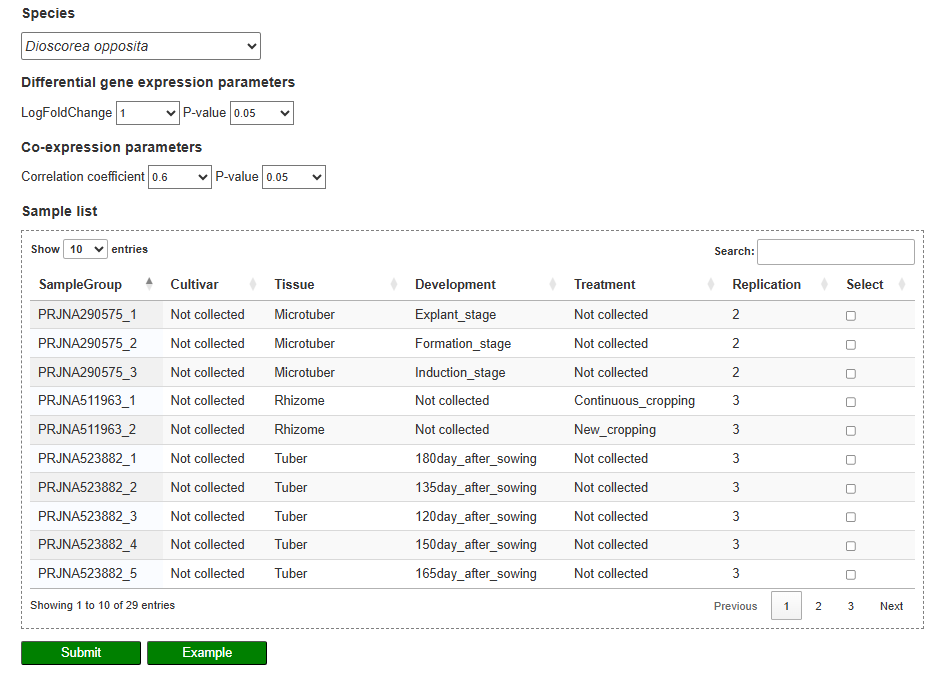
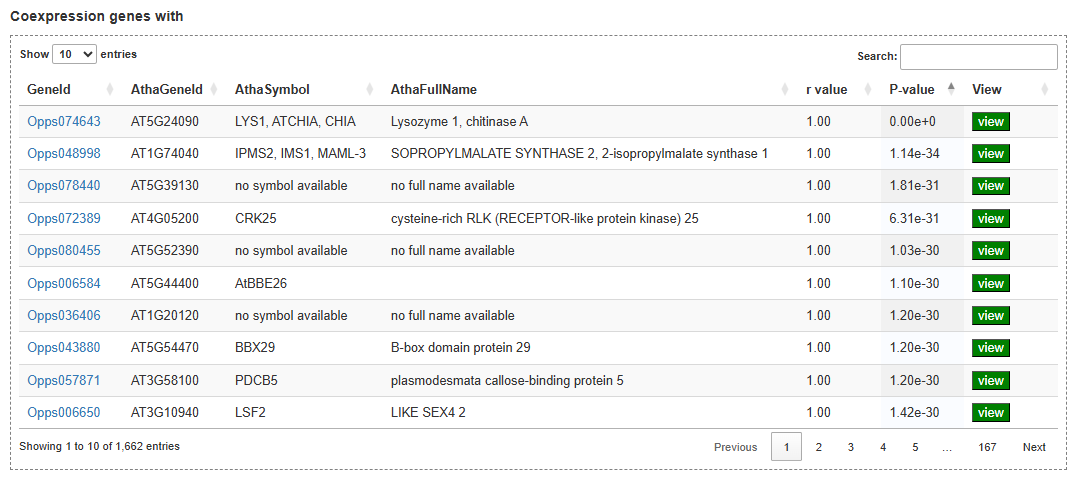
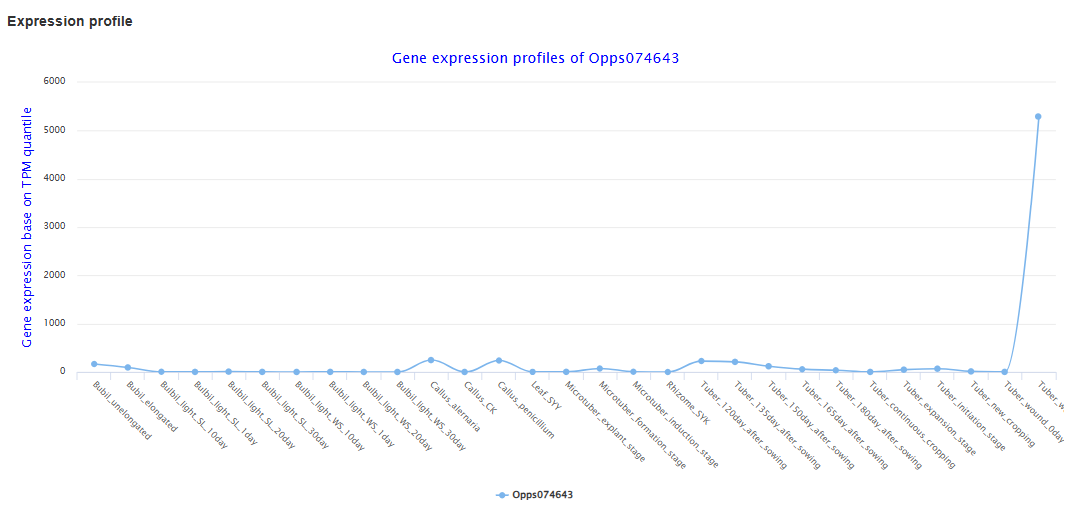
On the expression analysis page, users first choose the species, set thresholds for differential expression and co-expression (log₂ fold change, correlation coefficient, P-values), and select the RNA-seq sample groups to be compared. After submission, the results table lists genes that are significantly differentially expressed or co-expressed, together with statistics such as correlation coefficient and adjusted P-value, and provides links to view each gene in detail. By clicking on a gene ID, users can visualize its expression profile across all selected tissues, developmental stages, and treatments in an interactive line chart.
Contact
Jinding Liu
liujd@njau.edu.cn
References
The published papers providing omics data are as follows:
Jessen V., etc. Chromosome evolution and the genetic basis of agronomically important traits in greater yam. Nature Communications. 2021
Yu., et.al. Genome analyses reveal the hybrid origin of the staple crop white Guinea yam (Dioscorea rotundata). 2020. PNAS.
Satoshi., et al. Whole genome sequencing of a wild yam species Dioscorea tokoro reveals a genomic region associated with sex. bioRxiv, 2022.
Christian., et.al. High Contiguity De Novo Genome Sequence Assembly of Trifoliate Yam (Dioscorea dumetorum) Using Long Read Sequencing. Genes, 2020.
Yi., et al. The genome of Dioscorea zingiberensis sheds light on the biosynthesis, origin and evolution of the medicinally important diosgenin saponins. Horticulture, 2022.